THE SOCIOECONOMIC AND ENVIRONMENTAL NICHE OF PROTECTED AREAS REVEALS GLOBAL CONSERVATION GAPS AND OPPORTUNITIES
Mouillot D., Velez L., Albouy C., Casajus N., Claudet J., Delbar V., Devillers R., Letessier T.B., Loiseau N., Manel M., Mannocci L., Meeuwig J., Mouquet N., Nuno A., OConnor L., Parravicini P., Renaud J., Seguin R.,Troussellier T. & Thuiller W. (2024).
Nature Communications 15:9007. DOI:10.1038/s41467-024-53241-1
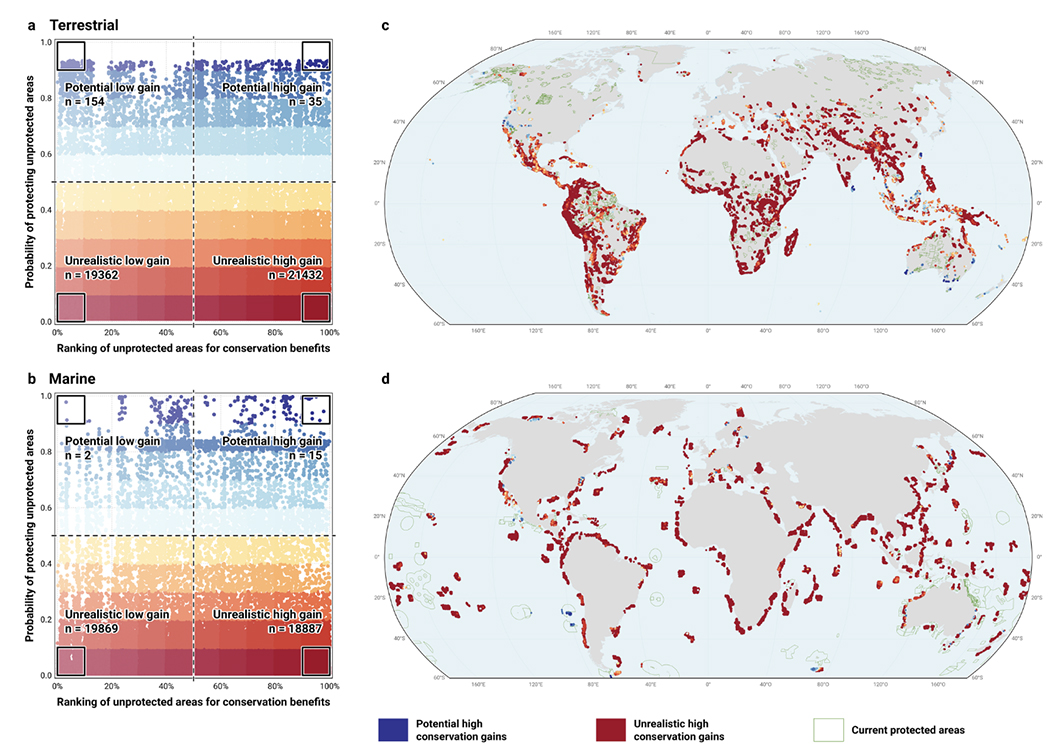
Here, using fourteen socioeconomic and environmental factors, we characterize the multidimensional niche of terrestrial and marine protected areas, which we use to accurately establish, at the global scale, whether a particular location has preconditions favorable for protected area establishment. We reveal that protected areas, particularly the most restrictive ones, over aggregate where human development and the number of nongovernmental organizations are high. Based on the spatial distribution of vertebrates and the likelihood to convert nonprotected areas into strictly protected areas, we identify potential versus unrealistic conservation gains on land and sea, which we define as areas of high vertebrate diversity that are, respectively, favorable and unfavorable to protected area establishment. Where protected areas are unrealistic, alternative strategies such as other effective area based conservation measures or privately protected areas, could deliver conservation outcomes.